Nejaušais ir modulis, kas atrodas NumPy bibliotēkā. Šis modulis satur funkcijas, kas tiek izmantotas nejaušu skaitļu ģenerēšanai. Šis modulis satur dažas vienkāršas izlases datu ģenerēšanas metodes, dažas permutācijas un sadales funkcijas, kā arī nejaušības ģeneratora funkcijas.
Visas funkcijas izlases modulī ir šādas:
Vienkārši nejauši dati
Ir šādas vienkāršu nejaušu datu funkcijas:
1) p.random.rand(d0, d1, ..., dn)
Šī nejaušā moduļa funkcija tiek izmantota, lai ģenerētu nejaušus skaitļus vai vērtības noteiktā formā.
Piemērs:
import numpy as np a=np.random.rand(5,2) a
Izvade:
array([[0.74710182, 0.13306399], [0.01463718, 0.47618842], [0.98980426, 0.48390004], [0.58661785, 0.62895758], [0.38432729, 0.90384119]])
2) np.random.randn(d0, d1, ..., dn)
Šī nejaušā moduļa funkcija atgriež paraugu no 'standarta normālā' sadalījuma.
Piemērs:
import numpy as np a=np.random.randn(2,2) a
Izvade:
array([[ 1.43327469, -0.02019121], [ 1.54626422, 1.05831067]]) b=np.random.randn() b -0.3080190768904835
3) np.random.randint(zems[, augsts, izmērs, dtips])
Šī nejaušā moduļa funkcija tiek izmantota, lai ģenerētu nejaušus veselus skaitļus no iekļaujoša (zems) līdz ekskluzīvai (augsta).
Piemērs:
import numpy as np a=np.random.randint(3, size=10) a
Izvade:
array([1, 1, 1, 2, 0, 0, 0, 0, 0, 0])
4) np.random.random_integers(mazs[, augsts, izmērs])
Šī nejaušā moduļa funkcija tiek izmantota, lai ģenerētu nejaušus veselus skaitļus ar np.int tipa skaitu starp zemu un augstu.
Piemērs:
import numpy as np a=np.random.random_integers(3) a b=type(np.random.random_integers(3)) b c=np.random.random_integers(5, size=(3,2)) c
Izvade:
2 array([[1, 1], [2, 5], [1, 3]])
5) np.random.random_sample([izmērs])
c# satur virkni
Šī nejaušā moduļa funkcija tiek izmantota, lai ģenerētu nejaušu pludiņu skaitu pusatvērtā intervālā [0.0, 1.0).
Piemērs:
import numpy as np a=np.random.random_sample() a b=type(np.random.random_sample()) b c=np.random.random_sample((5,)) c
Izvade:
0.09250360565571492 array([0.34665418, 0.47027209, 0.75944969, 0.37991244, 0.14159746])
6) np.random.random([izmērs])
Šī nejaušā moduļa funkcija tiek izmantota, lai ģenerētu nejaušu pludiņu skaitu pusatvērtā intervālā [0.0, 1.0).
Piemērs:
import numpy as np a=np.random.random() a b=type(np.random.random()) b c=np.random.random((5,)) c
Izvade:
0.008786953974334155 array([0.05530122, 0.59133394, 0.17258794, 0.6912388 , 0.33412534])
7) np.random.ranf([izmērs])
Šī nejaušā moduļa funkcija tiek izmantota, lai ģenerētu nejaušu pludiņu skaitu pusatvērtā intervālā [0.0, 1.0).
Piemērs:
import numpy as np a=np.random.ranf() a b=type(np.random.ranf()) b c=np.random.ranf((5,)) c
Izvade:
0.2907792098474542 array([0.34084881, 0.07268237, 0.38161256, 0.46494681, 0.88071377])
8) np.random.sample([izmērs])
Šī nejaušā moduļa funkcija tiek izmantota, lai ģenerētu nejaušu pludiņu skaitu pusatvērtā intervālā [0.0, 1.0).
Piemērs:
import numpy as np a=np.random.sample() a b=type(np.random.sample()) b c=np.random.sample((5,)) c
Izvade:
0.012298209913766511 array([0.71878544, 0.11486169, 0.38189074, 0.14303308, 0.07217287])
9) np.random.choice(a[, izmērs, aizstāt, p])
Šī nejaušā moduļa funkcija tiek izmantota, lai ģenerētu nejaušu paraugu no dotā 1-D masīva.
Piemērs:
import numpy as np a=np.random.choice(5,3) a b=np.random.choice(5,3, p=[0.2, 0.1, 0.4, 0.2, 0.1]) b
Izvade:
array([0, 3, 4]) array([2, 2, 2], dtype=int64)
10) np.random.bytes (garums)
Šī nejaušā moduļa funkcija tiek izmantota nejaušu baitu ģenerēšanai.
Piemērs:
import numpy as np a=np.random.bytes(7) a
Izvade:
'nQx08x83xf9xdex8a'
Permutācijas
Ir šādas permutācijas funkcijas:
1) np.random.shuffle()
Šī funkcija tiek izmantota, lai mainītu secību, sajaucot tās saturu.
Piemērs:
import numpy as np a=np.arange(12) a np.random.shuffle(a) a
Izvade:
array([ 0, 1, 2, 3, 4, 5, 6, 7, 8, 9, 10, 11]) array([10, 3, 2, 4, 5, 8, 0, 9, 1, 11, 7, 6])
2) np.random.permutation()
Šī funkcija nejauši maina secību vai atgriež permutētu diapazonu.
Piemērs:
import numpy as np a=np.random.permutation(12) a
Izvade:
array([ 8, 7, 3, 11, 6, 0, 9, 10, 2, 5, 4, 1])
Izplatījumi
Ir šādas permutācijas funkcijas:
1) beta (a, b[, izmērs])
Šo funkciju izmanto, lai ņemtu paraugus no beta izplatīšanas.
Piemērs:
def setup(self): self.dist = dist.beta self.cargs = [] self.ckwd = dict(alpha=2, beta=3) self.np_rand_fxn = numpy.random.beta self.np_args = [2, 3] self.np_kwds = dict()
2) binomiāls (n, p[, izmērs])
Šo funkciju izmanto, lai ņemtu paraugu no binoma sadalījuma.
Piemērs:
import numpy as np n, p = 10, .6 s1= np.random.binomial(n, p, 10) s1
Izvade:
array([6, 7, 7, 9, 3, 7, 8, 6, 6, 4])
3) kvadrātveida (df[, izmērs])
Šo funkciju izmanto, lai ņemtu paraugu no binoma sadalījuma.
Piemērs:
import numpy as np np.random.chisquare(2,4) sum(np.random.binomial(9, 0.1, 20000) == 0)/20000.
Izvade:
array([6, 7, 7, 9, 3, 7, 8, 6, 6, 4])
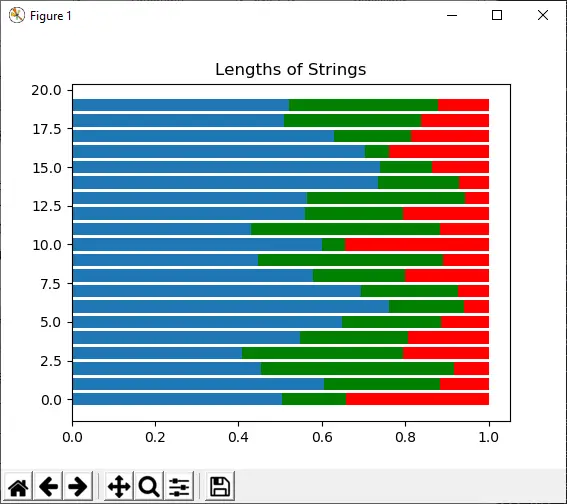
4) dirihlets (alfa[, izmērs])
Šo funkciju izmanto, lai ņemtu paraugu no Dirihleta sadalījuma.
Piemērs:
Import numpy as np import matplotlib.pyplot as plt s1 = np.random.dirichlet((10, 5, 3), 20).transpose() plt.barh(range(20), s1[0]) plt.barh(range(20), s1[1], left=s1[0], color='g') plt.barh(range(20), s1[2], left=s1[0]+s1[1], color='r') plt.title('Lengths of Strings') plt.show()
Izvade:
5) eksponenciāls ([mērogs, izmērs])
Šo funkciju izmanto, lai ņemtu paraugu no eksponenciālā sadalījuma.
Piemērs:
def __init__(self, sourceid, targetid): self.__type = 'Transaction' self.id = uuid4() self.source = sourceid self.target = targetid self.date = self._datetime.date(start=2015, end=2019) self.time = self._datetime.time() if random() <0.05: self.amount="self._numbers.between(100000," 1000000) if random() < 0.15: self.currency="self._business.currency_iso_code()" else: pre> <p> <strong>6) f(dfnum, dfden[, size])</strong> </p> <p>This function is used to draw sample from an F distribution.</p> <p> <strong>Example:</strong> </p> <pre> import numpy as np dfno= 1. dfden = 48. s1 = np.random.f(dfno, dfden, 10) np.sort(s1) </pre> <p> <strong>Output:</strong> </p> <pre> array([0.00264041, 0.04725478, 0.07140803, 0.19526217, 0.23979 , 0.24023478, 0.63141254, 0.95316446, 1.40281789, 1.68327507]) </pre> <p> <strong>7) gamma(shape[, scale, size])</strong> </p> <p>This function is used to draw sample from a Gamma distribution </p> <p> <strong>Example:</strong> </p> <pre> import numpy as np shape, scale = 2., 2. s1 = np.random.gamma(shape, scale, 1000) import matplotlib.pyplot as plt import scipy.special as spss count, bins, ignored = plt.hist(s1, 50, density=True) a = bins**(shape-1)*(np.exp(-bins/scale) / (spss.gamma(shape)*scale**shape)) plt.plot(bins, a, linewidth=2, color='r') plt.show() </pre> <img src="//techcodeview.com/img/numpy-tutorial/36/numpy-random-python-2.webp" alt="numpy.random in Python"> <p> <strong>8) geometric(p[, size])</strong> </p> <p>This function is used to draw sample from a geometric distribution. </p> <p> <strong>Example:</strong> </p> <pre> import numpy as np a = np.random.geometric(p=0.35, size=10000) (a == 1).sum() / 1000 </pre> <p> <strong>Output:</strong> </p> <pre> 3. </pre> <p> <strong>9) gumbel([loc, scale, size])</strong> </p> <p>This function is used to draw sample from a Gumble distribution.</p> <p> <strong>Example:</strong> </p> <pre> import numpy as np lov, scale = 0, 0.2 s1 = np.random.gumbel(loc, scale, 1000) import matplotlib.pyplot as plt count, bins, ignored = plt.hist(s1, 30, density=True) plt.plot(bins, (1/beta)*np.exp(-(bins - loc)/beta)* np.exp( -np.exp( -(bins - loc) /beta) ),linewidth=2, color='r') plt.show() </pre> <p> <strong>Output:</strong> </p> <img src="//techcodeview.com/img/numpy-tutorial/36/numpy-random-python-3.webp" alt="numpy.random in Python"> <p> <strong>10) hypergeometric(ngood, nbad, nsample[, size])</strong> </p> <p>This function is used to draw sample from a Hypergeometric distribution. </p> <p> <strong>Example:</strong> </p> <pre> import numpy as np good, bad, samp = 100, 2, 10 s1 = np.random.hypergeometric(good, bad, samp, 1000) plt.hist(s1) plt.show() </pre> <p> <strong>Output:</strong> </p> <pre> (array([ 13., 0., 0., 0., 0., 163., 0., 0., 0., 824.]), array([ 8. , 8.2, 8.4, 8.6, 8.8, 9. , 9.2, 9.4, 9.6, 9.8, 10. ]), <a 10 list of patch objects>) </a></pre> <p><img src="//techcodeview.com/img/numpy-tutorial/36/numpy-random-python-4.webp" alt="numpy.random in Python"></p> <p> <strong>11) laplace([loc, scale, size])</strong> </p> <p>This function is used to draw sample from the Laplace or double exponential distribution with specified location and scale.</p> <p> <strong>Example:</strong> </p> <pre> import numpy as np location, scale = 0., 2. s = np.random.laplace(location, scale, 10) s </pre> <p> <strong>Output:</strong> </p> <pre> array([-2.77127948, -1.46401453, -0.03723516, -1.61223942, 2.29590691, 1.74297722, 1.49438411, 0.30325513, -0.15948891, -4.99669747]) </pre> <p> <strong>12) logistic([loc, scale, size])</strong> </p> <p>This function is used to draw sample from logistic distribution. </p> <p> <strong>Example:</strong> </p> <pre> import numpy as np import matplotlib.pyplot as plt location, scale = 10, 1 s1 = np.random.logistic(location, scale, 10000) count, bins, ignored = plt.hist(s1, bins=50) count bins ignored plt.show() </pre> <p> <strong>Output:</strong> </p> <pre> array([1.000e+00, 1.000e+00, 1.000e+00, 0.000e+00, 1.000e+00, 1.000e+00, 1.000e+00, 5.000e+00, 7.000e+00, 1.100e+01, 1.800e+01, 3.500e+01, 5.300e+01, 6.700e+01, 1.150e+02, 1.780e+02, 2.300e+02, 3.680e+02, 4.910e+02, 6.400e+02, 8.250e+02, 9.100e+02, 9.750e+02, 1.039e+03, 9.280e+02, 8.040e+02, 6.530e+02, 5.240e+02, 3.380e+02, 2.470e+02, 1.650e+02, 1.150e+02, 8.500e+01, 6.400e+01, 3.300e+01, 1.600e+01, 2.400e+01, 1.400e+01, 4.000e+00, 5.000e+00, 2.000e+00, 2.000e+00, 1.000e+00, 1.000e+00, 0.000e+00, 1.000e+00, 0.000e+00, 0.000e+00, 0.000e+00, 1.000e+00]) array([ 0.50643911, 0.91891814, 1.33139717, 1.7438762 , 2.15635523, 2.56883427, 2.9813133 , 3.39379233, 3.80627136, 4.2187504 , 4.63122943, 5.04370846, 5.45618749, 5.86866652, 6.28114556, 6.69362459, 7.10610362, 7.51858265, 7.93106169, 8.34354072, 8.75601975, 9.16849878, 9.58097781, 9.99345685, 10.40593588, 10.81841491, 11.23089394, 11.64337298, 12.05585201, 12.46833104, 12.88081007, 13.2932891 , 13.70576814, 14.11824717, 14.5307262 , 14.94320523, 15.35568427, 15.7681633 , 16.18064233, 16.59312136, 17.00560039, 17.41807943, 17.83055846, 18.24303749, 18.65551652, 19.06799556, 19.48047459, 19.89295362, 20.30543265, 20.71791168, 21.13039072]) <a 50 list of patch objects> </a></pre> <p><img src="//techcodeview.com/img/numpy-tutorial/36/numpy-random-python-5.webp" alt="numpy.random in Python"></p> <p> <strong>13) lognormal([mean, sigma, size])</strong> </p> <p>This function is used to draw sample from a log-normal distribution.</p> <p> <strong>Example:</strong> </p> <pre> import numpy as np mu, sigma = 2., 1. s1 = np.random.lognormal(mu, sigma, 1000) import matplotlib.pyplot as plt count, bins, ignored = plt.hist(s1, 100, density=True, ) a = np.linspace(min(bins), max(bins), 10000) pdf = (np.exp(-(np.log(a) - mu)**2 / (2 * sigma**2))/ (a * sigma * np.sqrt(2 * np.pi))) plt.plot(a, pdf, linewidth=2, color='r') plt.axis('tight') plt.show() </pre> <p> <strong>Output:</strong> </p> <img src="//techcodeview.com/img/numpy-tutorial/36/numpy-random-python-6.webp" alt="numpy.random in Python"> <p> <strong>14) logseries(p[, size])</strong> </p> <p>This function is used to draw sample from a logarithmic distribution. </p> <p> <strong>Example:</strong> </p> <pre> import numpy as np x = .6 s1 = np.random.logseries(x, 10000) count, bins, ignored = plt.hist(s1) def logseries(k, p): return -p**k/(k*log(1-p)) plt.plot(bins, logseries(bins, x)*count.max()/logseries(bins, a).max(), 'r') plt.show() </pre> <p> <strong>Output:</strong> </p> <img src="//techcodeview.com/img/numpy-tutorial/36/numpy-random-python-7.webp" alt="numpy.random in Python"> <p> <strong>15) multinomial(n, pvals[, size])</strong> </p> <p>This function is used to draw sample from a multinomial distribution. </p> <p> <strong>Example:</strong> </p> <pre> import numpy as np np.random.multinomial(20, [1/6.]*6, size=1) </pre> <p> <strong>Output:</strong> </p> <pre> array([[4, 2, 5, 5, 3, 1]]) </pre> <p> <strong>16) multivariate_normal(mean, cov[, size, ...)</strong> </p> <p>This function is used to draw sample from a multivariate normal distribution. </p> <p> <strong>Example:</strong> </p> <pre> import numpy as np mean = (1, 2) coveriance = [[1, 0], [0, 100]] import matplotlib.pyplot as plt a, b = np.random.multivariate_normal(mean, coveriance, 5000).T plt.plot(a, b, 'x') plt.axis('equal'023 030 ) plt.show() </pre> <p> <strong>Output:</strong> </p> <img src="//techcodeview.com/img/numpy-tutorial/36/numpy-random-python-8.webp" alt="numpy.random in Python"> <p> <strong>17) negative_binomial(n, p[, size])</strong> </p> <p>This function is used to draw sample from a negative binomial distribution. </p> <p> <strong>Example:</strong> </p> <pre> import numpy as np s1 = np.random.negative_binomial(1, 0.1, 100000) for i in range(1, 11): probability = sum(s1 <i) 36 100000. print i, 'wells drilled, probability of one success=", probability </pre> <p> <strong>Output:</strong> </p> <pre> 1 wells drilled, probability of one success = 0 2 wells drilled, probability of one success = 0 3 wells drilled, probability of one success = 0 4 wells drilled, probability of one success = 0 5 wells drilled, probability of one success = 0 6 wells drilled, probability of one success = 0 7 wells drilled, probability of one success = 0 8 wells drilled, probability of one success = 0 9 wells drilled, probability of one success = 0 10 wells drilled, probability of one success = 0 </pre> <p > <strong>18) noncentral_chisquare(df, nonc[, size])</strong> </p> <p>This function is used to draw sample from a noncentral chi-square distribution. </p> <p> <strong>Example:</strong> </p> <pre> import numpy as np import matplotlib.pyplot as plt val = plt.hist(np.random.noncentral_chisquare(3, 25, 100000), bins=200, normed=True) plt.show() </pre> <p> <strong>Output:</strong> </p> <img src=" techcodeview.com img numpy-tutorial numpy-random-python-9.webp' alt="numpy.random in Python"> <p> <strong>19) normal([loc, scale, size])</strong> </p> <p>This function is used to draw sample from a normal distribution.</p> <p> <strong>Example:</strong> </p> <pre> import numpy as np import matplotlib.pyplot as plt mu, sigma = 0, 0.2 # mean and standard deviation s1 = np.random.normal(mu, sigma, 1000) abs(mu - np.mean(s1)) <0.01 1 abs(sigma - np.std(s1, ddof="1))" < 0.01 count, bins, ignored="plt.hist(s1," 30, density="True)" plt.plot(bins, (sigma * np.sqrt(2 np.pi)) *np.exp( (bins mu)**2 (2 sigma**2) ), linewidth="2," color="r" ) plt.show() pre> <p> <strong>Output:</strong> </p> <img src="//techcodeview.com/img/numpy-tutorial/36/numpy-random-python-10.webp" alt="numpy.random in Python"> <p> <strong>20) pareto(a[, size])</strong> </p> <p>This function is used to draw samples from a Lomax or Pareto II with specified shape.</p> <p> <strong>Example:</strong> </p> <pre> import numpy as np import matplotlib.pyplot as plt b, m1 = 3., 2. # shape and mode s1 = (np.random.pareto(b, 1000) + 1) * m1 count, bins, _ = plt.hist(s1, 100, density=True) fit = b*m**b / bins**(b+1) plt.plot(bins, max(count)*fit/max(fit), linewidth=2, color='r') plt.show() </pre> <p> <strong>Output:</strong> </p> <img src="//techcodeview.com/img/numpy-tutorial/36/numpy-random-python-11.webp" alt="numpy.random in Python"> <p> <strong>21) power(a[, size])</strong> </p> <p>This function is used to draw samples in [0, 1] from a power distribution with positive exponent a-1.</p> <p> <strong>Example:</strong> </p> <pre> import numpy as np x = 5. # shape samples = 1000 s1 = np.random.power(x, samples) import matplotlib.pyplot as plt count, bins, ignored = plt.hist(s1, bins=30) a = np.linspace(0, 1, 100) b = x*a**(x-1.) density_b = samples*np.diff(bins)[0]*b plt.plot(a, density_b) plt.show() </pre> <p> <strong>Output:</strong> </p> <img src="//techcodeview.com/img/numpy-tutorial/36/numpy-random-python-12.webp" alt="numpy.random in Python"> <p> <strong>22) rayleigh([scale, size])</strong> </p> <p>This function is used to draw sample from a Rayleigh distribution.</p> <p> <strong>Example:</strong> </p> <pre> val = hist(np.random.rayleigh(3, 100000), bins=200, density=True) meanval = 1 modeval = np.sqrt(2 / np.pi) * meanval s1 = np.random.rayleigh(modeval, 1000000) 100.*sum(s1>3)/1000000. </pre> <p> <strong>Output:</strong> </p> <pre> 0.087300000000000003 </pre> <p><img src="//techcodeview.com/img/numpy-tutorial/36/numpy-random-python-13.webp" alt="numpy.random in Python"></p> <p> <strong>23) standard_cauchy([size])</strong> </p> <p>This function is used to draw sample from a standard Cauchy distribution with mode=0.</p> <p> <strong>Example:</strong> </p> <pre> import numpy as np import matplotlib.pyplot as plt s1 = np.random.standard_cauchy(1000000) s1 = s1[(s1>-25) & (s1<25)] # truncate distribution so it plots well plt.hist(s1, bins="100)" plt.show() < pre> <p> <strong>Output:</strong> </p> <img src="//techcodeview.com/img/numpy-tutorial/36/numpy-random-python-14.webp" alt="numpy.random in Python"> <p> <strong>24) standard_exponential([size])</strong> </p> <p>This function is used to draw sample from a standard exponential distribution.</p> <p> <strong>Example:</strong> </p> <pre> import numpy as np n = np.random.standard_exponential((2, 7000)) </pre> <p> <strong>Output:</strong> </p> <pre> array([[0.53857931, 0.181262 , 0.20478701, ..., 3.66232881, 1.83882709, 1.77963295], [0.65163973, 1.40001955, 0.7525986 , ..., 0.76516523, 0.8400617 , 0.88551011]]) </pre> <p> <strong>25) standard_gamma([size])</strong> </p> <p>This function is used to draw sample from a standard Gamma distribution.</p> <p> <strong>Example:</strong> </p> <pre> import numpy as np shape, scale = 2., 1. s1 = np.random.standard_gamma(shape, 1000000) import matplotlib.pyplot as plt import scipy.special as sps count1, bins1, ignored1 = plt.hist(s, 50, density=True) y = bins1**(shape-1) * ((np.exp(-bins1/scale))/ (sps.gamma(shape) * scale**shape)) plt.plot(bins1, y, linewidth=2, color='r') plt.show() </pre> <p> <strong>Output:</strong> </p> <img src="//techcodeview.com/img/numpy-tutorial/36/numpy-random-python-15.webp" alt="numpy.random in Python"> <p> <strong>26) standard_normal([size])</strong> </p> <p>This function is used to draw sample from a standard Normal distribution.</p> <p> <strong>Example:</strong> </p> <pre> import numpy as np import matplotlib.pyplot as plt s1= np.random.standard_normal(8000) s1 q = np.random.standard_normal(size=(3, 4, 2)) q </pre> <p> <strong>Output:</strong> </p> <pre> array([-3.14907597, 0.95366265, -1.20100026, ..., 3.47180222, 0.9608679 , 0.0774319 ]) array([[[ 1.55635461, -1.29541713], [-1.50534663, -0.02829194], [ 1.03949348, -0.26128132], [ 1.51921798, 0.82136178]], [[-0.4011052 , -0.52458858], [-1.31803814, 0.37415379], [-0.67077365, 0.97447018], [-0.20212115, 0.67840888]], [[ 1.86183474, 0.19946562], [-0.07376021, 0.84599701], [-0.84341386, 0.32081667], [-3.32016062, -1.19029818]]]) </pre> <p> <strong>27) standard_t(df[, size])</strong> </p> <p>This function is used to draw sample from a standard Student's distribution with df degree of freedom.</p> <p> <strong>Example:</strong> </p> <pre> intake = np.array([5260., 5470, 5640, 6180, 6390, 6515, 6805, 7515,8230,8770]) s1 = np.random.standard_t(10, size=100000) np.mean(intake) intake.std(ddof=1) t = (np.mean(intake)-7725)/(intake.std(ddof=1)/np.sqrt(len(intake))) h = plt.hist(s1, bins=100, density=True) np.sum(s1<t) float(len(s1)) plt.show() < pre> <p> <strong>Output:</strong> </p> <pre> 6677.5 1174.1101831694598 0.00864 </pre> <p><img src="//techcodeview.com/img/numpy-tutorial/36/numpy-random-python-16.webp" alt="numpy.random in Python"></p> <p> <strong>28) triangular(left, mode, right[, size])</strong> </p> <p>This function is used to draw sample from a triangular distribution over the interval.</p> <p> <strong>Example:</strong> </p> <pre> import numpy as np import matplotlib.pyplot as plt h = plt.hist(np.random.triangular(-4, 0, 8, 1000000), bins=300,density=True) plt.show() </pre> <p> <strong>Output:</strong> </p> <img src="//techcodeview.com/img/numpy-tutorial/36/numpy-random-python-17.webp" alt="numpy.random in Python"> <p> <strong>29) uniform([low, high, size])</strong> </p> <p>This function is used to draw sample from a uniform distribution.</p> <p> <strong>Example:</strong> </p> <pre> import numpy as np import matplotlib.pyplot as plt s1 = np.random.uniform(-1,0,1000) np.all(s1 >= -1) np.all(s1 <0) count, bins, ignored="plt.hist(s1," 15, density="True)" plt.plot(bins, np.ones_like(bins), linewidth="2," color="r" ) plt.show() < pre> <p> <strong>Output:</strong> </p> <img src="//techcodeview.com/img/numpy-tutorial/36/numpy-random-python-18.webp" alt="numpy.random in Python"> <p> <strong>30) vonmises(m1, m2[, size])</strong> </p> <p>This function is used to draw sample from a von Mises distribution.</p> <p> <strong>Example:</strong> </p> <pre> import numpy as np import matplotlib.pyplot as plt m1, m2 = 0.0, 4.0 s1 = np.random.vonmises(m1, m2, 1000) from scipy.special import i0 plt.hist(s1, 50, density=True) x = np.linspace(-np.pi, np.pi, num=51) y = np.exp(m2*np.cos(x-m1))/(2*np.pi*i0(m2)) plt.plot(x, y, linewidth=2, color='r') plt.show() </pre> <p> <strong>Output:</strong> </p> <img src="//techcodeview.com/img/numpy-tutorial/36/numpy-random-python-19.webp" alt="numpy.random in Python"> <p> <strong>31) wald(mean, scale[, size])</strong> </p> <p>This function is used to draw sample from a Wald, or inverse Gaussian distribution.</p> <p> <strong>Example:</strong> </p> <pre> import numpy as np import matplotlib.pyplot as plt h = plt.hist(np.random.wald(3, 3, 100000), bins=250, density=True) plt.show() </pre> <p> <strong>Output:</strong> </p> <img src="//techcodeview.com/img/numpy-tutorial/36/numpy-random-python-20.webp" alt="numpy.random in Python"> <p> <strong>32) weibull(a[, size])</strong> </p> <p>This function is used to draw sample from a Weibull distribution.</p> <p> <strong>Example:</strong> </p> <pre> import numpy as np import matplotlib.pyplot as plt from scipy import special x=2.0 s=np.random.weibull(x, 1000) a = np.arange(1, 100.)/50. def weib(x, n, a): return (a/n)*(x/n)**np.exp(-(x/n)**a) count, bins, ignored = plt.hist(np.random.weibull(5.,1000)) a= np.arange(1,100.)/50. scale = count.max()/weib(x, 1., 5.).max() scale = count.max()/weib(a, 1., 5.).max() plt.plot(x, weib(x, 1., 5.)*scale) plt.show() </pre> <p> <strong>Output:</strong> </p> <img src="//techcodeview.com/img/numpy-tutorial/36/numpy-random-python-21.webp" alt="numpy.random in Python"> <p> <strong>33) zipf(a[, size])</strong> </p> <p>This function is used to draw sample from a Zipf distribution.</p> <p> <strong>Example:</strong> </p> <pre> import numpy as np import matplotlib.pyplot as plt from scipy import special x=2.0 s=np.random.zipf(x, 1000) count, bins, ignored = plt.hist(s[s<50], 50, density="True)" a="np.arange(1.," 50.) b="a**(-x)" special.zetac(x) plt.plot(a, max(b), linewidth="2," color="r" ) plt.show() < pre> <p> <strong>Output:</strong> </p> <img src="//techcodeview.com/img/numpy-tutorial/36/numpy-random-python-22.webp" alt="numpy.random in Python"> <hr></50],></pre></0)></pre></t)></pre></25)]></pre></0.01></pre></i)></pre></0.05:>
Izvade:
array([0.00264041, 0.04725478, 0.07140803, 0.19526217, 0.23979 , 0.24023478, 0.63141254, 0.95316446, 1.40281789, 1.68327507])
7) gamma (forma [, mērogs, izmērs])
Šo funkciju izmanto, lai ņemtu paraugu no gamma sadalījuma
Piemērs:
import numpy as np shape, scale = 2., 2. s1 = np.random.gamma(shape, scale, 1000) import matplotlib.pyplot as plt import scipy.special as spss count, bins, ignored = plt.hist(s1, 50, density=True) a = bins**(shape-1)*(np.exp(-bins/scale) / (spss.gamma(shape)*scale**shape)) plt.plot(bins, a, linewidth=2, color='r') plt.show()

8) ģeometrisks (p[, izmērs])
Šo funkciju izmanto, lai ņemtu paraugu no ģeometriskā sadalījuma.
Piemērs:
import numpy as np a = np.random.geometric(p=0.35, size=10000) (a == 1).sum() / 1000
Izvade:
3.
9) gumija ([vieta, mērogs, izmērs])
Šo funkciju izmanto, lai ņemtu paraugu no Gumble sadalījuma.
Piemērs:
import numpy as np lov, scale = 0, 0.2 s1 = np.random.gumbel(loc, scale, 1000) import matplotlib.pyplot as plt count, bins, ignored = plt.hist(s1, 30, density=True) plt.plot(bins, (1/beta)*np.exp(-(bins - loc)/beta)* np.exp( -np.exp( -(bins - loc) /beta) ),linewidth=2, color='r') plt.show()
Izvade:

10) hiperģeometrisks (nelabs, nbad, nsample[, izmērs])
Šo funkciju izmanto, lai ņemtu paraugu no hiperģeometriskā sadalījuma.
Piemērs:
import numpy as np good, bad, samp = 100, 2, 10 s1 = np.random.hypergeometric(good, bad, samp, 1000) plt.hist(s1) plt.show()
Izvade:
(array([ 13., 0., 0., 0., 0., 163., 0., 0., 0., 824.]), array([ 8. , 8.2, 8.4, 8.6, 8.8, 9. , 9.2, 9.4, 9.6, 9.8, 10. ]), <a 10 list of patch objects>) </a>

11) Laplass ([vieta, mērogs, izmērs])
Šo funkciju izmanto, lai ņemtu paraugu no Laplasa vai dubultā eksponenciālā sadalījuma ar noteiktu atrašanās vietu un mērogu.
Piemērs:
import numpy as np location, scale = 0., 2. s = np.random.laplace(location, scale, 10) s
Izvade:
array([-2.77127948, -1.46401453, -0.03723516, -1.61223942, 2.29590691, 1.74297722, 1.49438411, 0.30325513, -0.15948891, -4.99669747])
12) loģistika ([vieta, mērogs, izmērs])
Šo funkciju izmanto, lai ņemtu paraugu no loģistikas izplatīšanas.
Piemērs:
import numpy as np import matplotlib.pyplot as plt location, scale = 10, 1 s1 = np.random.logistic(location, scale, 10000) count, bins, ignored = plt.hist(s1, bins=50) count bins ignored plt.show()
Izvade:
array([1.000e+00, 1.000e+00, 1.000e+00, 0.000e+00, 1.000e+00, 1.000e+00, 1.000e+00, 5.000e+00, 7.000e+00, 1.100e+01, 1.800e+01, 3.500e+01, 5.300e+01, 6.700e+01, 1.150e+02, 1.780e+02, 2.300e+02, 3.680e+02, 4.910e+02, 6.400e+02, 8.250e+02, 9.100e+02, 9.750e+02, 1.039e+03, 9.280e+02, 8.040e+02, 6.530e+02, 5.240e+02, 3.380e+02, 2.470e+02, 1.650e+02, 1.150e+02, 8.500e+01, 6.400e+01, 3.300e+01, 1.600e+01, 2.400e+01, 1.400e+01, 4.000e+00, 5.000e+00, 2.000e+00, 2.000e+00, 1.000e+00, 1.000e+00, 0.000e+00, 1.000e+00, 0.000e+00, 0.000e+00, 0.000e+00, 1.000e+00]) array([ 0.50643911, 0.91891814, 1.33139717, 1.7438762 , 2.15635523, 2.56883427, 2.9813133 , 3.39379233, 3.80627136, 4.2187504 , 4.63122943, 5.04370846, 5.45618749, 5.86866652, 6.28114556, 6.69362459, 7.10610362, 7.51858265, 7.93106169, 8.34354072, 8.75601975, 9.16849878, 9.58097781, 9.99345685, 10.40593588, 10.81841491, 11.23089394, 11.64337298, 12.05585201, 12.46833104, 12.88081007, 13.2932891 , 13.70576814, 14.11824717, 14.5307262 , 14.94320523, 15.35568427, 15.7681633 , 16.18064233, 16.59312136, 17.00560039, 17.41807943, 17.83055846, 18.24303749, 18.65551652, 19.06799556, 19.48047459, 19.89295362, 20.30543265, 20.71791168, 21.13039072]) <a 50 list of patch objects> </a>

13) lognormāls ([vidējais, sigma, izmērs])
Šo funkciju izmanto, lai ņemtu paraugu no log-normālā sadalījuma.
Piemērs:
import numpy as np mu, sigma = 2., 1. s1 = np.random.lognormal(mu, sigma, 1000) import matplotlib.pyplot as plt count, bins, ignored = plt.hist(s1, 100, density=True, ) a = np.linspace(min(bins), max(bins), 10000) pdf = (np.exp(-(np.log(a) - mu)**2 / (2 * sigma**2))/ (a * sigma * np.sqrt(2 * np.pi))) plt.plot(a, pdf, linewidth=2, color='r') plt.axis('tight') plt.show()
Izvade:

14) žurnālu sērija (p[, izmērs])
virkne līdz veselam skaitlim Java
Šo funkciju izmanto, lai ņemtu paraugu no logaritmiskā sadalījuma.
Piemērs:
import numpy as np x = .6 s1 = np.random.logseries(x, 10000) count, bins, ignored = plt.hist(s1) def logseries(k, p): return -p**k/(k*log(1-p)) plt.plot(bins, logseries(bins, x)*count.max()/logseries(bins, a).max(), 'r') plt.show()
Izvade:

15) multinomiāls (n, pvals[, izmērs])
Šo funkciju izmanto, lai ņemtu paraugu no daudznomu sadalījuma.
Piemērs:
import numpy as np np.random.multinomial(20, [1/6.]*6, size=1)
Izvade:
array([[4, 2, 5, 5, 3, 1]])
16) daudzfaktoru_normāls(vidējais, cov[, izmērs, ...)
Šo funkciju izmanto, lai ņemtu paraugu no daudzfaktoru normālā sadalījuma.
Piemērs:
import numpy as np mean = (1, 2) coveriance = [[1, 0], [0, 100]] import matplotlib.pyplot as plt a, b = np.random.multivariate_normal(mean, coveriance, 5000).T plt.plot(a, b, 'x') plt.axis('equal'023 030 ) plt.show()
Izvade:

17) negatīvs_binomiāls(n, p[, izmērs])
Šo funkciju izmanto, lai ņemtu paraugu no negatīva binoma sadalījuma.
Piemērs:
import numpy as np s1 = np.random.negative_binomial(1, 0.1, 100000) for i in range(1, 11): probability = sum(s1 <i) 36 100000. print i, \'wells drilled, probability of one success=", probability </pre> <p> <strong>Output:</strong> </p> <pre> 1 wells drilled, probability of one success = 0 2 wells drilled, probability of one success = 0 3 wells drilled, probability of one success = 0 4 wells drilled, probability of one success = 0 5 wells drilled, probability of one success = 0 6 wells drilled, probability of one success = 0 7 wells drilled, probability of one success = 0 8 wells drilled, probability of one success = 0 9 wells drilled, probability of one success = 0 10 wells drilled, probability of one success = 0 </pre> <p > <strong>18) noncentral_chisquare(df, nonc[, size])</strong> </p> <p>This function is used to draw sample from a noncentral chi-square distribution. </p> <p> <strong>Example:</strong> </p> <pre> import numpy as np import matplotlib.pyplot as plt val = plt.hist(np.random.noncentral_chisquare(3, 25, 100000), bins=200, normed=True) plt.show() </pre> <p> <strong>Output:</strong> </p> <img src=" techcodeview.com img numpy-tutorial numpy-random-python-9.webp\' alt="numpy.random in Python"> <p> <strong>19) normal([loc, scale, size])</strong> </p> <p>This function is used to draw sample from a normal distribution.</p> <p> <strong>Example:</strong> </p> <pre> import numpy as np import matplotlib.pyplot as plt mu, sigma = 0, 0.2 # mean and standard deviation s1 = np.random.normal(mu, sigma, 1000) abs(mu - np.mean(s1)) <0.01 1 abs(sigma - np.std(s1, ddof="1))" < 0.01 count, bins, ignored="plt.hist(s1," 30, density="True)" plt.plot(bins, (sigma * np.sqrt(2 np.pi)) *np.exp( (bins mu)**2 (2 sigma**2) ), linewidth="2," color="r" ) plt.show() pre> <p> <strong>Output:</strong> </p> <img src="//techcodeview.com/img/numpy-tutorial/36/numpy-random-python-10.webp" alt="numpy.random in Python"> <p> <strong>20) pareto(a[, size])</strong> </p> <p>This function is used to draw samples from a Lomax or Pareto II with specified shape.</p> <p> <strong>Example:</strong> </p> <pre> import numpy as np import matplotlib.pyplot as plt b, m1 = 3., 2. # shape and mode s1 = (np.random.pareto(b, 1000) + 1) * m1 count, bins, _ = plt.hist(s1, 100, density=True) fit = b*m**b / bins**(b+1) plt.plot(bins, max(count)*fit/max(fit), linewidth=2, color='r') plt.show() </pre> <p> <strong>Output:</strong> </p> <img src="//techcodeview.com/img/numpy-tutorial/36/numpy-random-python-11.webp" alt="numpy.random in Python"> <p> <strong>21) power(a[, size])</strong> </p> <p>This function is used to draw samples in [0, 1] from a power distribution with positive exponent a-1.</p> <p> <strong>Example:</strong> </p> <pre> import numpy as np x = 5. # shape samples = 1000 s1 = np.random.power(x, samples) import matplotlib.pyplot as plt count, bins, ignored = plt.hist(s1, bins=30) a = np.linspace(0, 1, 100) b = x*a**(x-1.) density_b = samples*np.diff(bins)[0]*b plt.plot(a, density_b) plt.show() </pre> <p> <strong>Output:</strong> </p> <img src="//techcodeview.com/img/numpy-tutorial/36/numpy-random-python-12.webp" alt="numpy.random in Python"> <p> <strong>22) rayleigh([scale, size])</strong> </p> <p>This function is used to draw sample from a Rayleigh distribution.</p> <p> <strong>Example:</strong> </p> <pre> val = hist(np.random.rayleigh(3, 100000), bins=200, density=True) meanval = 1 modeval = np.sqrt(2 / np.pi) * meanval s1 = np.random.rayleigh(modeval, 1000000) 100.*sum(s1>3)/1000000. </pre> <p> <strong>Output:</strong> </p> <pre> 0.087300000000000003 </pre> <p><img src="//techcodeview.com/img/numpy-tutorial/36/numpy-random-python-13.webp" alt="numpy.random in Python"></p> <p> <strong>23) standard_cauchy([size])</strong> </p> <p>This function is used to draw sample from a standard Cauchy distribution with mode=0.</p> <p> <strong>Example:</strong> </p> <pre> import numpy as np import matplotlib.pyplot as plt s1 = np.random.standard_cauchy(1000000) s1 = s1[(s1>-25) & (s1<25)] # truncate distribution so it plots well plt.hist(s1, bins="100)" plt.show() < pre> <p> <strong>Output:</strong> </p> <img src="//techcodeview.com/img/numpy-tutorial/36/numpy-random-python-14.webp" alt="numpy.random in Python"> <p> <strong>24) standard_exponential([size])</strong> </p> <p>This function is used to draw sample from a standard exponential distribution.</p> <p> <strong>Example:</strong> </p> <pre> import numpy as np n = np.random.standard_exponential((2, 7000)) </pre> <p> <strong>Output:</strong> </p> <pre> array([[0.53857931, 0.181262 , 0.20478701, ..., 3.66232881, 1.83882709, 1.77963295], [0.65163973, 1.40001955, 0.7525986 , ..., 0.76516523, 0.8400617 , 0.88551011]]) </pre> <p> <strong>25) standard_gamma([size])</strong> </p> <p>This function is used to draw sample from a standard Gamma distribution.</p> <p> <strong>Example:</strong> </p> <pre> import numpy as np shape, scale = 2., 1. s1 = np.random.standard_gamma(shape, 1000000) import matplotlib.pyplot as plt import scipy.special as sps count1, bins1, ignored1 = plt.hist(s, 50, density=True) y = bins1**(shape-1) * ((np.exp(-bins1/scale))/ (sps.gamma(shape) * scale**shape)) plt.plot(bins1, y, linewidth=2, color='r') plt.show() </pre> <p> <strong>Output:</strong> </p> <img src="//techcodeview.com/img/numpy-tutorial/36/numpy-random-python-15.webp" alt="numpy.random in Python"> <p> <strong>26) standard_normal([size])</strong> </p> <p>This function is used to draw sample from a standard Normal distribution.</p> <p> <strong>Example:</strong> </p> <pre> import numpy as np import matplotlib.pyplot as plt s1= np.random.standard_normal(8000) s1 q = np.random.standard_normal(size=(3, 4, 2)) q </pre> <p> <strong>Output:</strong> </p> <pre> array([-3.14907597, 0.95366265, -1.20100026, ..., 3.47180222, 0.9608679 , 0.0774319 ]) array([[[ 1.55635461, -1.29541713], [-1.50534663, -0.02829194], [ 1.03949348, -0.26128132], [ 1.51921798, 0.82136178]], [[-0.4011052 , -0.52458858], [-1.31803814, 0.37415379], [-0.67077365, 0.97447018], [-0.20212115, 0.67840888]], [[ 1.86183474, 0.19946562], [-0.07376021, 0.84599701], [-0.84341386, 0.32081667], [-3.32016062, -1.19029818]]]) </pre> <p> <strong>27) standard_t(df[, size])</strong> </p> <p>This function is used to draw sample from a standard Student's distribution with df degree of freedom.</p> <p> <strong>Example:</strong> </p> <pre> intake = np.array([5260., 5470, 5640, 6180, 6390, 6515, 6805, 7515,8230,8770]) s1 = np.random.standard_t(10, size=100000) np.mean(intake) intake.std(ddof=1) t = (np.mean(intake)-7725)/(intake.std(ddof=1)/np.sqrt(len(intake))) h = plt.hist(s1, bins=100, density=True) np.sum(s1<t) float(len(s1)) plt.show() < pre> <p> <strong>Output:</strong> </p> <pre> 6677.5 1174.1101831694598 0.00864 </pre> <p><img src="//techcodeview.com/img/numpy-tutorial/36/numpy-random-python-16.webp" alt="numpy.random in Python"></p> <p> <strong>28) triangular(left, mode, right[, size])</strong> </p> <p>This function is used to draw sample from a triangular distribution over the interval.</p> <p> <strong>Example:</strong> </p> <pre> import numpy as np import matplotlib.pyplot as plt h = plt.hist(np.random.triangular(-4, 0, 8, 1000000), bins=300,density=True) plt.show() </pre> <p> <strong>Output:</strong> </p> <img src="//techcodeview.com/img/numpy-tutorial/36/numpy-random-python-17.webp" alt="numpy.random in Python"> <p> <strong>29) uniform([low, high, size])</strong> </p> <p>This function is used to draw sample from a uniform distribution.</p> <p> <strong>Example:</strong> </p> <pre> import numpy as np import matplotlib.pyplot as plt s1 = np.random.uniform(-1,0,1000) np.all(s1 >= -1) np.all(s1 <0) count, bins, ignored="plt.hist(s1," 15, density="True)" plt.plot(bins, np.ones_like(bins), linewidth="2," color="r" ) plt.show() < pre> <p> <strong>Output:</strong> </p> <img src="//techcodeview.com/img/numpy-tutorial/36/numpy-random-python-18.webp" alt="numpy.random in Python"> <p> <strong>30) vonmises(m1, m2[, size])</strong> </p> <p>This function is used to draw sample from a von Mises distribution.</p> <p> <strong>Example:</strong> </p> <pre> import numpy as np import matplotlib.pyplot as plt m1, m2 = 0.0, 4.0 s1 = np.random.vonmises(m1, m2, 1000) from scipy.special import i0 plt.hist(s1, 50, density=True) x = np.linspace(-np.pi, np.pi, num=51) y = np.exp(m2*np.cos(x-m1))/(2*np.pi*i0(m2)) plt.plot(x, y, linewidth=2, color='r') plt.show() </pre> <p> <strong>Output:</strong> </p> <img src="//techcodeview.com/img/numpy-tutorial/36/numpy-random-python-19.webp" alt="numpy.random in Python"> <p> <strong>31) wald(mean, scale[, size])</strong> </p> <p>This function is used to draw sample from a Wald, or inverse Gaussian distribution.</p> <p> <strong>Example:</strong> </p> <pre> import numpy as np import matplotlib.pyplot as plt h = plt.hist(np.random.wald(3, 3, 100000), bins=250, density=True) plt.show() </pre> <p> <strong>Output:</strong> </p> <img src="//techcodeview.com/img/numpy-tutorial/36/numpy-random-python-20.webp" alt="numpy.random in Python"> <p> <strong>32) weibull(a[, size])</strong> </p> <p>This function is used to draw sample from a Weibull distribution.</p> <p> <strong>Example:</strong> </p> <pre> import numpy as np import matplotlib.pyplot as plt from scipy import special x=2.0 s=np.random.weibull(x, 1000) a = np.arange(1, 100.)/50. def weib(x, n, a): return (a/n)*(x/n)**np.exp(-(x/n)**a) count, bins, ignored = plt.hist(np.random.weibull(5.,1000)) a= np.arange(1,100.)/50. scale = count.max()/weib(x, 1., 5.).max() scale = count.max()/weib(a, 1., 5.).max() plt.plot(x, weib(x, 1., 5.)*scale) plt.show() </pre> <p> <strong>Output:</strong> </p> <img src="//techcodeview.com/img/numpy-tutorial/36/numpy-random-python-21.webp" alt="numpy.random in Python"> <p> <strong>33) zipf(a[, size])</strong> </p> <p>This function is used to draw sample from a Zipf distribution.</p> <p> <strong>Example:</strong> </p> <pre> import numpy as np import matplotlib.pyplot as plt from scipy import special x=2.0 s=np.random.zipf(x, 1000) count, bins, ignored = plt.hist(s[s<50], 50, density="True)" a="np.arange(1.," 50.) b="a**(-x)" special.zetac(x) plt.plot(a, max(b), linewidth="2," color="r" ) plt.show() < pre> <p> <strong>Output:</strong> </p> <img src="//techcodeview.com/img/numpy-tutorial/36/numpy-random-python-22.webp" alt="numpy.random in Python"> <hr></50],></pre></0)></pre></t)></pre></25)]></pre></0.01></pre></i)>
Izvade:

21) jauda (a[, izmērs])
Šo funkciju izmanto, lai ņemtu paraugus [0, 1] no jaudas sadalījuma ar pozitīvu eksponentu a-1.
Piemērs:
import numpy as np x = 5. # shape samples = 1000 s1 = np.random.power(x, samples) import matplotlib.pyplot as plt count, bins, ignored = plt.hist(s1, bins=30) a = np.linspace(0, 1, 100) b = x*a**(x-1.) density_b = samples*np.diff(bins)[0]*b plt.plot(a, density_b) plt.show()
Izvade:

22) rayeigh ([mērogs, izmērs])
Šo funkciju izmanto, lai ņemtu paraugu no Rayleigh sadalījuma.
Piemērs:
val = hist(np.random.rayleigh(3, 100000), bins=200, density=True) meanval = 1 modeval = np.sqrt(2 / np.pi) * meanval s1 = np.random.rayleigh(modeval, 1000000) 100.*sum(s1>3)/1000000.
Izvade:
0.087300000000000003

23) standarta_cauchy([izmērs])
Šo funkciju izmanto, lai ņemtu paraugu no standarta Košī sadalījuma ar mode=0.
Piemērs:
import numpy as np import matplotlib.pyplot as plt s1 = np.random.standard_cauchy(1000000) s1 = s1[(s1>-25) & (s1<25)] # truncate distribution so it plots well plt.hist(s1, bins="100)" plt.show() < pre> <p> <strong>Output:</strong> </p> <img src="//techcodeview.com/img/numpy-tutorial/36/numpy-random-python-14.webp" alt="numpy.random in Python"> <p> <strong>24) standard_exponential([size])</strong> </p> <p>This function is used to draw sample from a standard exponential distribution.</p> <p> <strong>Example:</strong> </p> <pre> import numpy as np n = np.random.standard_exponential((2, 7000)) </pre> <p> <strong>Output:</strong> </p> <pre> array([[0.53857931, 0.181262 , 0.20478701, ..., 3.66232881, 1.83882709, 1.77963295], [0.65163973, 1.40001955, 0.7525986 , ..., 0.76516523, 0.8400617 , 0.88551011]]) </pre> <p> <strong>25) standard_gamma([size])</strong> </p> <p>This function is used to draw sample from a standard Gamma distribution.</p> <p> <strong>Example:</strong> </p> <pre> import numpy as np shape, scale = 2., 1. s1 = np.random.standard_gamma(shape, 1000000) import matplotlib.pyplot as plt import scipy.special as sps count1, bins1, ignored1 = plt.hist(s, 50, density=True) y = bins1**(shape-1) * ((np.exp(-bins1/scale))/ (sps.gamma(shape) * scale**shape)) plt.plot(bins1, y, linewidth=2, color='r') plt.show() </pre> <p> <strong>Output:</strong> </p> <img src="//techcodeview.com/img/numpy-tutorial/36/numpy-random-python-15.webp" alt="numpy.random in Python"> <p> <strong>26) standard_normal([size])</strong> </p> <p>This function is used to draw sample from a standard Normal distribution.</p> <p> <strong>Example:</strong> </p> <pre> import numpy as np import matplotlib.pyplot as plt s1= np.random.standard_normal(8000) s1 q = np.random.standard_normal(size=(3, 4, 2)) q </pre> <p> <strong>Output:</strong> </p> <pre> array([-3.14907597, 0.95366265, -1.20100026, ..., 3.47180222, 0.9608679 , 0.0774319 ]) array([[[ 1.55635461, -1.29541713], [-1.50534663, -0.02829194], [ 1.03949348, -0.26128132], [ 1.51921798, 0.82136178]], [[-0.4011052 , -0.52458858], [-1.31803814, 0.37415379], [-0.67077365, 0.97447018], [-0.20212115, 0.67840888]], [[ 1.86183474, 0.19946562], [-0.07376021, 0.84599701], [-0.84341386, 0.32081667], [-3.32016062, -1.19029818]]]) </pre> <p> <strong>27) standard_t(df[, size])</strong> </p> <p>This function is used to draw sample from a standard Student's distribution with df degree of freedom.</p> <p> <strong>Example:</strong> </p> <pre> intake = np.array([5260., 5470, 5640, 6180, 6390, 6515, 6805, 7515,8230,8770]) s1 = np.random.standard_t(10, size=100000) np.mean(intake) intake.std(ddof=1) t = (np.mean(intake)-7725)/(intake.std(ddof=1)/np.sqrt(len(intake))) h = plt.hist(s1, bins=100, density=True) np.sum(s1<t) float(len(s1)) plt.show() < pre> <p> <strong>Output:</strong> </p> <pre> 6677.5 1174.1101831694598 0.00864 </pre> <p><img src="//techcodeview.com/img/numpy-tutorial/36/numpy-random-python-16.webp" alt="numpy.random in Python"></p> <p> <strong>28) triangular(left, mode, right[, size])</strong> </p> <p>This function is used to draw sample from a triangular distribution over the interval.</p> <p> <strong>Example:</strong> </p> <pre> import numpy as np import matplotlib.pyplot as plt h = plt.hist(np.random.triangular(-4, 0, 8, 1000000), bins=300,density=True) plt.show() </pre> <p> <strong>Output:</strong> </p> <img src="//techcodeview.com/img/numpy-tutorial/36/numpy-random-python-17.webp" alt="numpy.random in Python"> <p> <strong>29) uniform([low, high, size])</strong> </p> <p>This function is used to draw sample from a uniform distribution.</p> <p> <strong>Example:</strong> </p> <pre> import numpy as np import matplotlib.pyplot as plt s1 = np.random.uniform(-1,0,1000) np.all(s1 >= -1) np.all(s1 <0) count, bins, ignored="plt.hist(s1," 15, density="True)" plt.plot(bins, np.ones_like(bins), linewidth="2," color="r" ) plt.show() < pre> <p> <strong>Output:</strong> </p> <img src="//techcodeview.com/img/numpy-tutorial/36/numpy-random-python-18.webp" alt="numpy.random in Python"> <p> <strong>30) vonmises(m1, m2[, size])</strong> </p> <p>This function is used to draw sample from a von Mises distribution.</p> <p> <strong>Example:</strong> </p> <pre> import numpy as np import matplotlib.pyplot as plt m1, m2 = 0.0, 4.0 s1 = np.random.vonmises(m1, m2, 1000) from scipy.special import i0 plt.hist(s1, 50, density=True) x = np.linspace(-np.pi, np.pi, num=51) y = np.exp(m2*np.cos(x-m1))/(2*np.pi*i0(m2)) plt.plot(x, y, linewidth=2, color='r') plt.show() </pre> <p> <strong>Output:</strong> </p> <img src="//techcodeview.com/img/numpy-tutorial/36/numpy-random-python-19.webp" alt="numpy.random in Python"> <p> <strong>31) wald(mean, scale[, size])</strong> </p> <p>This function is used to draw sample from a Wald, or inverse Gaussian distribution.</p> <p> <strong>Example:</strong> </p> <pre> import numpy as np import matplotlib.pyplot as plt h = plt.hist(np.random.wald(3, 3, 100000), bins=250, density=True) plt.show() </pre> <p> <strong>Output:</strong> </p> <img src="//techcodeview.com/img/numpy-tutorial/36/numpy-random-python-20.webp" alt="numpy.random in Python"> <p> <strong>32) weibull(a[, size])</strong> </p> <p>This function is used to draw sample from a Weibull distribution.</p> <p> <strong>Example:</strong> </p> <pre> import numpy as np import matplotlib.pyplot as plt from scipy import special x=2.0 s=np.random.weibull(x, 1000) a = np.arange(1, 100.)/50. def weib(x, n, a): return (a/n)*(x/n)**np.exp(-(x/n)**a) count, bins, ignored = plt.hist(np.random.weibull(5.,1000)) a= np.arange(1,100.)/50. scale = count.max()/weib(x, 1., 5.).max() scale = count.max()/weib(a, 1., 5.).max() plt.plot(x, weib(x, 1., 5.)*scale) plt.show() </pre> <p> <strong>Output:</strong> </p> <img src="//techcodeview.com/img/numpy-tutorial/36/numpy-random-python-21.webp" alt="numpy.random in Python"> <p> <strong>33) zipf(a[, size])</strong> </p> <p>This function is used to draw sample from a Zipf distribution.</p> <p> <strong>Example:</strong> </p> <pre> import numpy as np import matplotlib.pyplot as plt from scipy import special x=2.0 s=np.random.zipf(x, 1000) count, bins, ignored = plt.hist(s[s<50], 50, density="True)" a="np.arange(1.," 50.) b="a**(-x)" special.zetac(x) plt.plot(a, max(b), linewidth="2," color="r" ) plt.show() < pre> <p> <strong>Output:</strong> </p> <img src="//techcodeview.com/img/numpy-tutorial/36/numpy-random-python-22.webp" alt="numpy.random in Python"> <hr></50],></pre></0)></pre></t)></pre></25)]>
Izvade:
array([[0.53857931, 0.181262 , 0.20478701, ..., 3.66232881, 1.83882709, 1.77963295], [0.65163973, 1.40001955, 0.7525986 , ..., 0.76516523, 0.8400617 , 0.88551011]])
25) standarta_gamma([izmērs])
Šo funkciju izmanto, lai ņemtu paraugu no standarta gamma sadalījuma.
Piemērs:
import numpy as np shape, scale = 2., 1. s1 = np.random.standard_gamma(shape, 1000000) import matplotlib.pyplot as plt import scipy.special as sps count1, bins1, ignored1 = plt.hist(s, 50, density=True) y = bins1**(shape-1) * ((np.exp(-bins1/scale))/ (sps.gamma(shape) * scale**shape)) plt.plot(bins1, y, linewidth=2, color='r') plt.show()
Izvade:

26) standarta_parasts([izmērs])
Šo funkciju izmanto, lai ņemtu paraugu no standarta parastā sadalījuma.
Piemērs:
import numpy as np import matplotlib.pyplot as plt s1= np.random.standard_normal(8000) s1 q = np.random.standard_normal(size=(3, 4, 2)) q
Izvade:
array([-3.14907597, 0.95366265, -1.20100026, ..., 3.47180222, 0.9608679 , 0.0774319 ]) array([[[ 1.55635461, -1.29541713], [-1.50534663, -0.02829194], [ 1.03949348, -0.26128132], [ 1.51921798, 0.82136178]], [[-0.4011052 , -0.52458858], [-1.31803814, 0.37415379], [-0.67077365, 0.97447018], [-0.20212115, 0.67840888]], [[ 1.86183474, 0.19946562], [-0.07376021, 0.84599701], [-0.84341386, 0.32081667], [-3.32016062, -1.19029818]]])
27) standarta_t(df[, izmērs])
Šo funkciju izmanto, lai ņemtu paraugu no standarta Studenta sadalījuma ar df brīvības pakāpi.
nfa piemēri
Piemērs:
intake = np.array([5260., 5470, 5640, 6180, 6390, 6515, 6805, 7515,8230,8770]) s1 = np.random.standard_t(10, size=100000) np.mean(intake) intake.std(ddof=1) t = (np.mean(intake)-7725)/(intake.std(ddof=1)/np.sqrt(len(intake))) h = plt.hist(s1, bins=100, density=True) np.sum(s1<t) float(len(s1)) plt.show() < pre> <p> <strong>Output:</strong> </p> <pre> 6677.5 1174.1101831694598 0.00864 </pre> <p><img src="//techcodeview.com/img/numpy-tutorial/36/numpy-random-python-16.webp" alt="numpy.random in Python"></p> <p> <strong>28) triangular(left, mode, right[, size])</strong> </p> <p>This function is used to draw sample from a triangular distribution over the interval.</p> <p> <strong>Example:</strong> </p> <pre> import numpy as np import matplotlib.pyplot as plt h = plt.hist(np.random.triangular(-4, 0, 8, 1000000), bins=300,density=True) plt.show() </pre> <p> <strong>Output:</strong> </p> <img src="//techcodeview.com/img/numpy-tutorial/36/numpy-random-python-17.webp" alt="numpy.random in Python"> <p> <strong>29) uniform([low, high, size])</strong> </p> <p>This function is used to draw sample from a uniform distribution.</p> <p> <strong>Example:</strong> </p> <pre> import numpy as np import matplotlib.pyplot as plt s1 = np.random.uniform(-1,0,1000) np.all(s1 >= -1) np.all(s1 <0) count, bins, ignored="plt.hist(s1," 15, density="True)" plt.plot(bins, np.ones_like(bins), linewidth="2," color="r" ) plt.show() < pre> <p> <strong>Output:</strong> </p> <img src="//techcodeview.com/img/numpy-tutorial/36/numpy-random-python-18.webp" alt="numpy.random in Python"> <p> <strong>30) vonmises(m1, m2[, size])</strong> </p> <p>This function is used to draw sample from a von Mises distribution.</p> <p> <strong>Example:</strong> </p> <pre> import numpy as np import matplotlib.pyplot as plt m1, m2 = 0.0, 4.0 s1 = np.random.vonmises(m1, m2, 1000) from scipy.special import i0 plt.hist(s1, 50, density=True) x = np.linspace(-np.pi, np.pi, num=51) y = np.exp(m2*np.cos(x-m1))/(2*np.pi*i0(m2)) plt.plot(x, y, linewidth=2, color='r') plt.show() </pre> <p> <strong>Output:</strong> </p> <img src="//techcodeview.com/img/numpy-tutorial/36/numpy-random-python-19.webp" alt="numpy.random in Python"> <p> <strong>31) wald(mean, scale[, size])</strong> </p> <p>This function is used to draw sample from a Wald, or inverse Gaussian distribution.</p> <p> <strong>Example:</strong> </p> <pre> import numpy as np import matplotlib.pyplot as plt h = plt.hist(np.random.wald(3, 3, 100000), bins=250, density=True) plt.show() </pre> <p> <strong>Output:</strong> </p> <img src="//techcodeview.com/img/numpy-tutorial/36/numpy-random-python-20.webp" alt="numpy.random in Python"> <p> <strong>32) weibull(a[, size])</strong> </p> <p>This function is used to draw sample from a Weibull distribution.</p> <p> <strong>Example:</strong> </p> <pre> import numpy as np import matplotlib.pyplot as plt from scipy import special x=2.0 s=np.random.weibull(x, 1000) a = np.arange(1, 100.)/50. def weib(x, n, a): return (a/n)*(x/n)**np.exp(-(x/n)**a) count, bins, ignored = plt.hist(np.random.weibull(5.,1000)) a= np.arange(1,100.)/50. scale = count.max()/weib(x, 1., 5.).max() scale = count.max()/weib(a, 1., 5.).max() plt.plot(x, weib(x, 1., 5.)*scale) plt.show() </pre> <p> <strong>Output:</strong> </p> <img src="//techcodeview.com/img/numpy-tutorial/36/numpy-random-python-21.webp" alt="numpy.random in Python"> <p> <strong>33) zipf(a[, size])</strong> </p> <p>This function is used to draw sample from a Zipf distribution.</p> <p> <strong>Example:</strong> </p> <pre> import numpy as np import matplotlib.pyplot as plt from scipy import special x=2.0 s=np.random.zipf(x, 1000) count, bins, ignored = plt.hist(s[s<50], 50, density="True)" a="np.arange(1.," 50.) b="a**(-x)" special.zetac(x) plt.plot(a, max(b), linewidth="2," color="r" ) plt.show() < pre> <p> <strong>Output:</strong> </p> <img src="//techcodeview.com/img/numpy-tutorial/36/numpy-random-python-22.webp" alt="numpy.random in Python"> <hr></50],></pre></0)></pre></t)>

28) trīsstūrveida (pa kreisi, režīms, pa labi[, izmērs])
Šo funkciju izmanto, lai ņemtu paraugu no trīsstūrveida sadalījuma pa intervālu.
Piemērs:
import numpy as np import matplotlib.pyplot as plt h = plt.hist(np.random.triangular(-4, 0, 8, 1000000), bins=300,density=True) plt.show()
Izvade:

29) uniforma ([zems, augsts, izmērs])
Šo funkciju izmanto, lai ņemtu paraugu no vienmērīga sadalījuma.
Piemērs:
import numpy as np import matplotlib.pyplot as plt s1 = np.random.uniform(-1,0,1000) np.all(s1 >= -1) np.all(s1 <0) count, bins, ignored="plt.hist(s1," 15, density="True)" plt.plot(bins, np.ones_like(bins), linewidth="2," color="r" ) plt.show() < pre> <p> <strong>Output:</strong> </p> <img src="//techcodeview.com/img/numpy-tutorial/36/numpy-random-python-18.webp" alt="numpy.random in Python"> <p> <strong>30) vonmises(m1, m2[, size])</strong> </p> <p>This function is used to draw sample from a von Mises distribution.</p> <p> <strong>Example:</strong> </p> <pre> import numpy as np import matplotlib.pyplot as plt m1, m2 = 0.0, 4.0 s1 = np.random.vonmises(m1, m2, 1000) from scipy.special import i0 plt.hist(s1, 50, density=True) x = np.linspace(-np.pi, np.pi, num=51) y = np.exp(m2*np.cos(x-m1))/(2*np.pi*i0(m2)) plt.plot(x, y, linewidth=2, color='r') plt.show() </pre> <p> <strong>Output:</strong> </p> <img src="//techcodeview.com/img/numpy-tutorial/36/numpy-random-python-19.webp" alt="numpy.random in Python"> <p> <strong>31) wald(mean, scale[, size])</strong> </p> <p>This function is used to draw sample from a Wald, or inverse Gaussian distribution.</p> <p> <strong>Example:</strong> </p> <pre> import numpy as np import matplotlib.pyplot as plt h = plt.hist(np.random.wald(3, 3, 100000), bins=250, density=True) plt.show() </pre> <p> <strong>Output:</strong> </p> <img src="//techcodeview.com/img/numpy-tutorial/36/numpy-random-python-20.webp" alt="numpy.random in Python"> <p> <strong>32) weibull(a[, size])</strong> </p> <p>This function is used to draw sample from a Weibull distribution.</p> <p> <strong>Example:</strong> </p> <pre> import numpy as np import matplotlib.pyplot as plt from scipy import special x=2.0 s=np.random.weibull(x, 1000) a = np.arange(1, 100.)/50. def weib(x, n, a): return (a/n)*(x/n)**np.exp(-(x/n)**a) count, bins, ignored = plt.hist(np.random.weibull(5.,1000)) a= np.arange(1,100.)/50. scale = count.max()/weib(x, 1., 5.).max() scale = count.max()/weib(a, 1., 5.).max() plt.plot(x, weib(x, 1., 5.)*scale) plt.show() </pre> <p> <strong>Output:</strong> </p> <img src="//techcodeview.com/img/numpy-tutorial/36/numpy-random-python-21.webp" alt="numpy.random in Python"> <p> <strong>33) zipf(a[, size])</strong> </p> <p>This function is used to draw sample from a Zipf distribution.</p> <p> <strong>Example:</strong> </p> <pre> import numpy as np import matplotlib.pyplot as plt from scipy import special x=2.0 s=np.random.zipf(x, 1000) count, bins, ignored = plt.hist(s[s<50], 50, density="True)" a="np.arange(1.," 50.) b="a**(-x)" special.zetac(x) plt.plot(a, max(b), linewidth="2," color="r" ) plt.show() < pre> <p> <strong>Output:</strong> </p> <img src="//techcodeview.com/img/numpy-tutorial/36/numpy-random-python-22.webp" alt="numpy.random in Python"> <hr></50],></pre></0)>
Izvade:

31) wald(vidējais, mērogs[, izmērs])
Šo funkciju izmanto, lai ņemtu paraugu no Wald jeb apgrieztā Gausa sadalījuma.
Piemērs:
import numpy as np import matplotlib.pyplot as plt h = plt.hist(np.random.wald(3, 3, 100000), bins=250, density=True) plt.show()
Izvade:

32) Weibull(a[, izmērs])
Šo funkciju izmanto, lai ņemtu paraugu no Veibula sadalījuma.
Piemērs:
import numpy as np import matplotlib.pyplot as plt from scipy import special x=2.0 s=np.random.weibull(x, 1000) a = np.arange(1, 100.)/50. def weib(x, n, a): return (a/n)*(x/n)**np.exp(-(x/n)**a) count, bins, ignored = plt.hist(np.random.weibull(5.,1000)) a= np.arange(1,100.)/50. scale = count.max()/weib(x, 1., 5.).max() scale = count.max()/weib(a, 1., 5.).max() plt.plot(x, weib(x, 1., 5.)*scale) plt.show()
Izvade:

33) zipf (a[, izmērs])
Šo funkciju izmanto, lai ņemtu paraugu no Zipf sadalījuma.
Piemērs:
import numpy as np import matplotlib.pyplot as plt from scipy import special x=2.0 s=np.random.zipf(x, 1000) count, bins, ignored = plt.hist(s[s<50], 50, density="True)" a="np.arange(1.," 50.) b="a**(-x)" special.zetac(x) plt.plot(a, max(b), linewidth="2," color="r" ) plt.show() < pre> <p> <strong>Output:</strong> </p> <img src="//techcodeview.com/img/numpy-tutorial/36/numpy-random-python-22.webp" alt="numpy.random in Python"> <hr></50],>